From the Calculated Risk Blog

Calculated Risk Construction Spending declined in June, Public Construction Spending at Lowest Level since 2006 ISM Manufacturing index increases in July to 55.4 Weekly Initial Unemployment Claims decline to 326,000 Thursday: Vehicle Sales, Unemployment Claims, ISM Mfg Index, Construction Spending Fannie Mae: Mortgage Serious Delinquency rate declined in June, Lowest since December 2008 FOMC Statement: ...

Calculated Risk


Construction Spending declined in June, Public Construction Spending at Lowest Level since 2006

Posted: 01 Aug 2013 08:55 AM PDT

The Census Bureau reported that overall construction spending declined in June:

The U.S. Census Bureau of the Department of Commerce announced today that construction spending during June 2013 was estimated at a seasonally adjusted annual rate of $883.9 billion, 0.6 percent below the revised May estimate of $889.4 billion. The June figure is 3.3 percent above the June 2012 estimate of $855.8 billion.

Spending on private construction was at a seasonally adjusted annual rate of $622.8 billion, 0.4 percent below the revised May estimate of $625.4 billion. …

In June, the estimated seasonally adjusted annual rate of public construction spending was $261.1 billion, 1.1 percent below the revised May estimate of $264.0 billion.

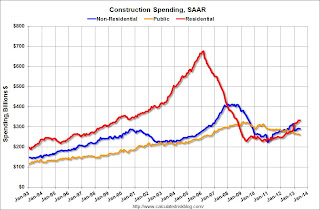
http://3.bp.blogspot.com/-Pe0FXUcJ3Qc/UfqBEJIZtVI/AAAAAAAAbTs/nJGcXNbtsJM/s1600/ConstructionSpendJune2013.jpgClick on graph for larger image.

This graph shows private residential and nonresidential construction spending, and public spending, since 1993. Note: nominal dollars, not inflation adjusted.

Private residential spending is 51% below the peak in early 2006, and up 45% from the post-bubble low.

Non-residential spending is 30% below the peak in January 2008, and up about 29% from the recent low.

Public construction spending is now 20% below the peak in March 2009 and at the lowest level since 2006.

http://4.bp.blogspot.com/-0pTsNTPdQzY/UfqBHitLNSI/AAAAAAAAbT0/Mi6TjEUC2ts/s1600/ConstructionSpendYoYJune2013.jpgThe second graph shows the year-over-year change in construction spending.

On a year-over-year basis, private residential construction spending is now up 23%. Non-residential spending is up slightly year-over-year. Public spending is down 9.3% year-over-year.

A few key themes:
1) Private residential construction is usually the largest category for construction spending, and is now the largest category once again.  Usually private residential construction leads the economy, so this is a good sign going forward.

2) Private non-residential construction spending usually lags the economy.  There was some increase this time for a couple of years – mostly related to energy and power – but the key sectors of office, retail and hotels are still at very low levels.  I expect private non-residential to start to increase later this year.

3) Public construction spending decreased in June.  Public spending has declined to 2006 levels (not adjusted for inflation) and has been a drag on the economy for 4 years. In real terms, public construction spending has declined to 2001 levels.

The good news going forward is 1) private residential construction spending is still very low and will probably continue to increase over the next few years, 2) Private non-residential spending appears about to increase (see forecast from American Institute of Architects, and 3) public construction spending is probably close to a bottom.

ISM Manufacturing index increases in July to 55.4

Posted: 01 Aug 2013 07:05 AM PDT

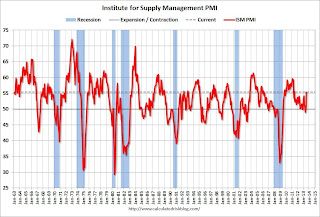
The ISM manufacturing index indicated faster expansion in July. The PMI was at 55.4% in July, up from 50.9% in June. The employment index was at 54.4%, up from 48.7%, and the new orders index was at 58.3%, up from 51.9% in June.

From the Institute for Supply Management: July 2013 Manufacturing ISM Report On Business®

Economic activity in the manufacturing sector expanded in July for the second consecutive month, and the overall economy grew for the 50th consecutive month, say the nation’s supply executives in the latest Manufacturing ISM Report On Business®.

The report was issued today by Bradley J. Holcomb, CPSM, CPSD, chair of the Institute for Supply Management™ Manufacturing Business Survey Committee. “The PMI™ registered 55.4 percent, an increase of 4.5 percentage points from June’s reading of 50.9 percent. June’s PMI™ reading, the highest of the year, indicates expansion in the manufacturing sector for the second consecutive month. The New Orders Index increased in July by 6.4 percentage points to 58.3 percent, and the Production Index increased by 11.6 percentage points to 65 percent. The Employment Index registered 54.4 percent, an increase of 5.7 percentage points compared to June’s reading of 48.7 percent. The Prices Index registered 49 percent, decreasing 3.5 percentage points from June, indicating that overall raw materials prices decreased from last month. Comments from the panel generally indicate stable demand and slowly improving business conditions.”
emphasis added

http://2.bp.blogspot.com/-XL8FMtvlZks/Ufpqh-zkcEI/AAAAAAAAbTc/rdhair0NO2c/s1600/ISMJuly2013.jpgClick on graph for larger image.

Here is a long term graph of the ISM manufacturing index.

This was above expectations of 53.1% and suggests manufacturing expanded at a faster pace in July.

Weekly Initial Unemployment Claims decline to 326,000

Posted: 01 Aug 2013 06:00 AM PDT

The DOL reports:

In the week ending July 27, the advance figure for seasonally adjusted initial claims was 326,000, a decrease of 19,000 from the previous week’s revised figure of 345,000. The 4-week moving average was 341,250, a decrease of 4,500 from the previous week’s revised average of 345,750.

The previous week was revised up from 343,000.

The following graph shows the 4-week moving average of weekly claims since January 2000.

http://3.bp.blogspot.com/-cPcAeWnI50Y/UfpVvoxqI0I/AAAAAAAAbTM/08MFdFPRgqg/s1600/WeeklyClaimsAug12013.jpgClick on graph for larger image.

The dashed line on the graph is the current 4-week average. The four-week average of weekly unemployment claims decreased to 341,250.

The 4-week average has mostly moved sideways over the last few months, and is near the low for the year.  Claims were below to the 345,000 consensus forecast.

Thursday: Vehicle Sales, Unemployment Claims, ISM Mfg Index, Construction Spending

Posted: 31 Jul 2013 05:29 PM PDT

Restaurant spending is discretionary, so even though this is “D-list” data, I like to check it every month.

From the National Restaurant Association: Despite June Decline, Restaurant Performance Index Remains Steadily Positive

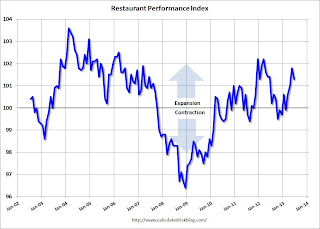
As a result of positive sales and traffic and an optimistic outlook among restaurant operators, the National Restaurant Association’s Restaurant Performance Index (RPI) remained in expansion territory in June. The RPI – a monthly composite index that tracks the health of and outlook for the U.S. restaurant industry – stood at 101.3 in June, down 0.5 percent from May’s level of 101.8. Despite the decline, June represented the fourth consecutive month that the RPI exceeded the 100 level, which signifies expansion in the index of key industry indicators.

“Although the overall RPI dipped somewhat in June, it remained in positive territory as restaurant operators continued to report gains in both sales and customer traffic,” said Hudson Riehle, senior vice president of the Research and Knowledge Group for the Association. “Looking forward, restaurant operators remain generally optimistic about the business environment in the months ahead, with the Expectations Index holding steady at a 12-month high.”

http://2.bp.blogspot.com/-TpHh3EIlrE8/UfmrFmzjS1I/AAAAAAAAbS8/L8Ptw-yQ8Nw/s1600/RPIJune2013.jpgClick on graph for larger image.

The index decreased to 101.3 in June from 101.8 in May. (above 100 indicates expansion).

Thursday:
• At 8:30 AM ET, theinitial weekly unemployment claims report will be released. The consensus is for an increase to 345 thousand from 343 thousand last week.

• All day: Light vehicle sales for July. The consensus is for light vehicle sales to decrease to 15.8 million SAAR in July (Seasonally Adjusted Annual Rate) from 15.9 million SAAR in June.

• At 9:00 AM, The Markit US PMI Manufacturing Index for July. The consensus is for the index to increase to 53.1 from 51.9 in June.

• At 10:00 AM, the ISM Manufacturing Index for July. The consensus is for an increase to 53.1 from 50.9 in June. Based on the regional surveys, an increase in July seems likely. The ISM manufacturing index indicated expansion in June at 50.9%. The employment index was at 48.7%, and the new orders index was at 51.9%.

• Also at 10:00 AM, Construction Spending for June. The consensus is for a 0.4% increase in construction spending.

Fannie Mae: Mortgage Serious Delinquency rate declined in June, Lowest since December 2008

Posted: 31 Jul 2013 01:11 PM PDT

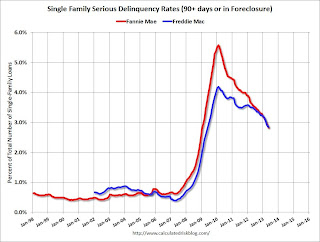
Fannie Mae reported today that the Single-Family Serious Delinquency rate declined in June to 2.77% from 2.83% in May. The serious delinquency rate is down from 3.53% in June 2012, and this is the lowest level since December 2008.

The Fannie Mae serious delinquency rate peaked in February 2010 at 5.59%.

Earlier Freddie Mac reported that the Single-Family serious delinquency rate declined in June to 2.79% from 2.85% in May. Freddie’s rate is down from 3.45% in June 2012, and is at the lowest level since May 2009. Freddie’s serious delinquency rate peaked in February 2010 at 4.20%.

Note: These are mortgage loans that are “three monthly payments or more past due or in foreclosure”.

http://2.bp.blogspot.com/-hd-KK-mosWM/Uc3u72inZzI/AAAAAAAAa6M/J3M-yM055co/s966/FannieFreddieMay2013.jpgClick on graph for larger image

Although this indicates progress, the “normal” serious delinquency rate is under 1%.

At the recent rate of improvement, the serious delinquency rate will not be under 1% until 2016 or so.

FOMC Statement: Downgrade from “moderate” to “modest”

Posted: 31 Jul 2013 12:02 PM PDT

Economic activity downgraded and more concern about inflation too low (update: added “too low).

FOMC Statement:

Information received since the Federal Open Market Committee met in June suggests that economic activity expanded at a modest paceduring the first half of the year. Labor market conditions have shown further improvement in recent months, on balance, but the unemployment rate remains elevated. Household spending and business fixed investment advanced, and the housing sector has been strengthening, but mortgage rates have risen somewhat and fiscal policy is restraining economic growth. Partly reflecting transitory influences, inflation has been running below the Committee’s longer-run objective, but longer-term inflation expectations have remained stable.

Consistent with its statutory mandate, the Committee seeks to foster maximum employment and price stability. The Committee expects that, with appropriate policy accommodation, economic growth will pick up from its recent pace and the unemployment rate will gradually decline toward levels the Committee judges consistent with its dual mandate. The Committee sees the downside risks to the outlook for the economy and the labor market as having diminished since the fall. The Committee recognizes that inflation persistently below its 2 percent objective could pose risks to economic performance, but it anticipates that inflation will move back toward its objective over the medium term.

To support a stronger economic recovery and to help ensure that inflation, over time, is at the rate most consistent with its dual mandate, the Committee decided to continue purchasing additional agency mortgage-backed securities at a pace of $40 billion per month and longer-term Treasury securities at a pace of $45 billion per month. The Committee is maintaining its existing policy of reinvesting principal payments from its holdings of agency debt and agency mortgage-backed securities in agency mortgage-backed securities and of rolling over maturing Treasury securities at auction. Taken together, these actions should maintain downward pressure on longer-term interest rates, support mortgage markets, and help to make broader financial conditions more accommodative.

The Committee will closely monitor incoming information on economic and financial developments in coming months. The Committee will continue its purchases of Treasury and agency mortgage-backed securities, and employ its other policy tools as appropriate, until the outlook for the labor market has improved substantially in a context of price stability. The Committee is prepared to increase or reduce the pace of its purchases to maintain appropriate policy accommodation as the outlook for the labor market or inflation changes. In determining the size, pace, and composition of its asset purchases, the Committee will continue to take appropriate account of the likely efficacy and costs of such purchases as well as the extent of progress toward its economic objectives.

To support continued progress toward maximum employment and price stability, the Committee today reaffirmed its view that a highly accommodative stance of monetary policy will remain appropriate for a considerable time after the asset purchase program ends and the economic recovery strengthens. In particular, the Committee decided to keep the target range for the federal funds rate at 0 to 1/4 percent and currently anticipates that this exceptionally low range for the federal funds rate will be appropriate at least as long as the unemployment rate remains above 6-1/2 percent, inflation between one and two years ahead is projected to be no more than a half percentage point above the Committee’s 2 percent longer-run goal, and longer-term inflation expectations continue to be well anchored. In determining how long to maintain a highly accommodative stance of monetary policy, the Committee will also consider other information, including additional measures of labor market conditions, indicators of inflation pressures and inflation expectations, and readings on financial developments. When the Committee decides to begin to remove policy accommodation, it will take a balanced approach consistent with its longer-run goals of maximum employment and inflation of 2 percent.

Voting for the FOMC monetary policy action were: Ben S. Bernanke, Chairman; William C. Dudley, Vice Chairman; James Bullard; Elizabeth A. Duke; Charles L. Evans; Jerome H. Powell; Sarah Bloom Raskin; Eric S. Rosengren; Jeremy C. Stein; Daniel K. Tarullo; and Janet L. Yellen. Voting against the action was Esther L. George, who was concerned that the continued high level of monetary accommodation increased the risks of future economic and financial imbalances and, over time, could cause an increase in long-term inflation expectations.
emphasis added